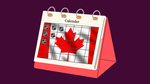
Are Birth Dates Still Destiny for Canadian NHL Players?
In the first chapter Malcolm Gladwell’s Outliers he discusses how in Canadian Junior Hockey there is a higher likelihood for players to be born in the first quarter of the year.
The Most Unexpectedly Good and Bad TV Episodes
The 9th episode of the 2nd Season of Ted Lasso is an episode called “Beard After Hours” which I found to be a pretty bad episode on a pretty good show.

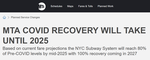
When Will NYC's Subway Ridership Recover?
While writing my posts about COVID’s effect on NYC Subway ridership the New York Times published an article called The Pandemic Wasn’t Supposed to Hurt New York Transit This Much.
Exploring Types of Subway Fares with Hierarchical Forecasting
In my prior post I used forecasting to look at the effect of COVID on the expected amount of New York City subway swipes. In this post I will drill a level deeper to run forecasts for various types of subway fares to see if any particularly type has recovered better or worse than any others.

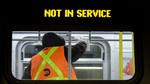
How much has COVID cost the NYC Subway system in "lost fares"?
With things in NYC beginning to return to normal after two years of COVID I found myself thinking about how much money was lost in Subway fares in the 2+ years where people were working from home.
ML for the Lazy: Can AutoML Beat My Model?
In this fourth (and hopefully final) entry in my “Icing the Kicker” series of posts, I’m going to jump back to the first post where I used tidymodels to predict whether or not a kick attempt would be iced.
Ain't Nothin But A G-Computation (and TMLE) Thang: Exploring Two More Causal Inference Methods
In my last post I looked at the causal effect of icing the kicker using weighting. Those results found that icing the kicker had a non-significant effect on the success of the field goal attempt with a point estimate of -2.
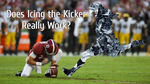
Does Icing the Kicker Really Work? A Causal Inference Exercise
In my prior post I looked at when coaches were most likly to ice a kicker where ‘icing a kicker’ means for a defense to call a timeout right before the offense is about to kick a field goal.
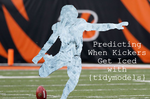
Predicting When Kickers Get Iced with {tidymodels}
I’m constantly on the lookout for things I can use for future posts for this blog. My goal is usually two-fold. First, what is a tool or technique I want to try/learn and second is there an interesting data set that I can use with those tools.
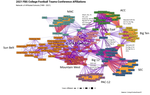
Examining College Football Conference Realignment with {ggraph}
In my previous post I looked at College Football Non-Conference games to create a network map overlaid on top of the United States using the {ggraph} package. In this post I’ll be extending that to examine Conference Realignment, which is when colleges change from one conference to the next.